Machine Learning with Python and Scikit
It is fascinating how fast one can build a text analyzer with Python and Scikit. Tutorials and examples on this abound. A common approach is to first build numerical representations of the text and then apply standard statistical (or machine learning) techniques. Basically, one inputs text examples to train the system; and then one uses previously unused data to apply the model and check the results. But I also wanted to know also how the intermediate data looks like. To this effect, I built a little example that writes the internal data into an Excel file to better visualize and understand how the feature extraction and the cluster building looks like.
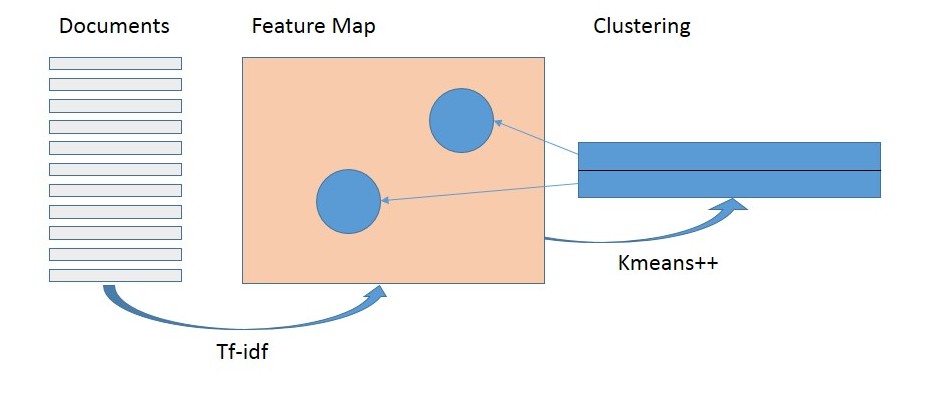
Here, we will use the tf-idf algorithm for feature extraction, check this tutorial, for example. In a second step we will use unsupervised learning to identify clusters in the feature map. For that, we use the KMeans++ algorithm from the Machine Learning module scikit. This allows us also to classify new text, i.e. identify to which cluster it belongs.
Preparation
First make sure you have numpy, scipy, scikit and XlsxWriter installed.
If not, run python -m pip install <module_name>
Then, in your Python file you need to import
from sklearn.feature_extraction.text import TfidfVectorizer
from sklearn.cluster import KMeans
import xlsxwriter
Data to start with
No learning without data. As an example, we use a set of sentences, all mentioning ‘Python’, some referring to the programming language others meaning the snake(s). We then want to see how the algorithms do distinguish them.
Here are the sentences, each representing a ‘document’.
# the list of documents, sometimes referred to as 'corpus'
list_of_documents = ["Python is a popular programming language.",
             "I do not like snakes, including Pythons.",
             "Some of Monty Python's shows were really fun.",
             "Python is a funny name for a programming language.",
             "Pythons are a family of nonvenomous snakes found in Africa, Asia, and Australia."]
Text Analyzer: Creating the feature map
# create the vectorizer and let it know that you want to get rid of english stop words, like 'a', 'the', ..
my_vectorizer = TfidfVectorizer(stop_words='english')

# the vectorizer returns a sparse array ..
my_sparseArray = my_vectorizer.fit_transform(list_of_documents)
#  ... for better understanding, we convert it into a standard matrix
myArray = my_sparseArray.toarray()

# let's get the dimensions of our array
print(myArray.shape)
# and see what words are actually our features
features = my_vectorizer.get_feature_names()
Writing the data to a spreadsheet
# we create a workbook and worksheet to write the data
workbook = xlsxwriter.Workbook("C:\Tfidf_test1.xlsx")
worksheet = workbook.add_worksheet()
# now we see the words that were extracted, i.e. stopwords are removed
col = 0
for word in features:
    worksheet.write(0, col, word)
    col += 1

# now let's add the feature matrix
for j in range(myArray.shape[1]):
    print(j)
    for i in range(myArray.shape[0]):
        worksheet.write(i+1, j, myArray[i][j] )
    last_row = i + 3    # let's remember the last row and add an empty one
Checking the clustering (unsupervised learning)
# find cluster specified number of clusters in the array using the KMeans algorithm
number_of_clusters = 2
model = KMeans(n_clusters=number_of_clusters, init='k-means++', max_iter=100, n_init=1)
model.fit(my_sparseArray)

# let' get the cluster coordinates and add them to the excel
cluster_coordinates = model.cluster_centers_
for j in range(cluster_coordinates .shape[1]):
    print(j)
    for i in range(cluster_coordinates.shape[0]):
        worksheet.write(last_row + i, j, cluster_coordinates [i][j] )

workbook.close()        # close the excel file, otherwise it would not be properly created
Interpreting the data
The file generated by the code above is shown below. The first row shows the words from the input data (list_of_documents), where the stop words are removed.
Row 2 – 6 show the feature map as generated by by the tf-idf algorithm. There is one line for each document, i.e. just a sentence in our example. High values mean that the word occurred in that document more often than across all documents. For example ‘popular’ is mentioned only in the first document.
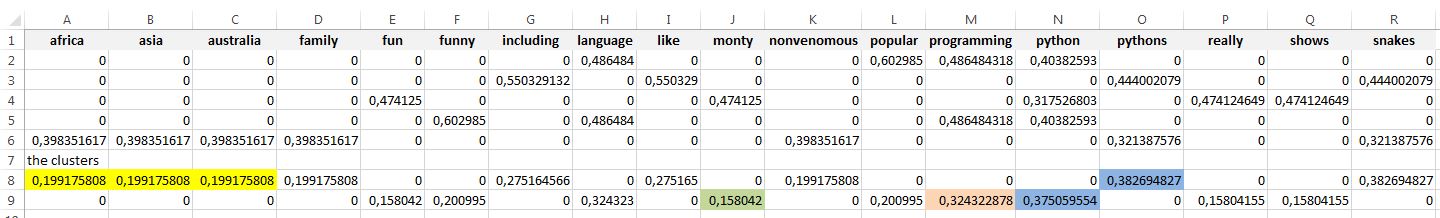
Lines 8 and 9 show the coordinates of the two clusters. The first cluster (line 8) stands for words where the document (sentence) is about the animal, which is when you mention continents (marked yellow) or use the plural, i.e. pythons (marked blue).
The second cluster stands for the programming language. Then, ‘Monty’ as the inspiration for naming the programming language shows up with a good value, but not so high, because there is another document (line 4) mentioning it. So for the data used here, the singular ‘Python’ and ‘programming’ are good indicators that the programming language is meant.
Classifying new text
Let’s now try the classifier with new data. To do so, we define a new document, which then we transform and let predict the cluster it is nearest to. Again, we write data into the spreadsheet to understand what is happening.
T = my_vectorizer.transform(["I like programming."])
Tarray = T.toarray()
for j in range(Tarray.shape[1]):
    worksheet.write(last_row + 3, j, Tarray[0][j])
classification = model.predict(T)
print(classification)

workbook.close()        # moved from above to here to close the excel file
Interpretation:
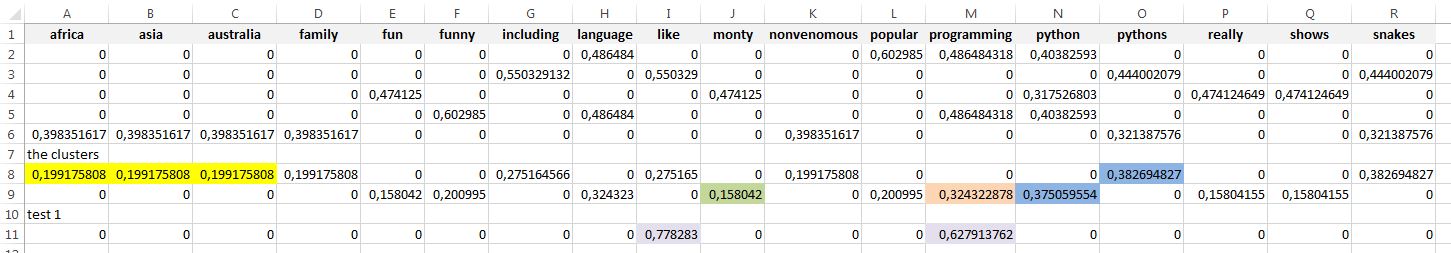
The screen shot below shows the formatted result. The new line 11 shows the numerical representation of our test data. We can see that the word ‘programming’ was decisive for the correct classification. The word ‘like’ was pushing more towards the ‘snake’ cluster. We received the correct (our interpretation) classification still, because the test vector was closer to what we say is the correct cluster.
My conclusions
Python and its modules are great tools to develop complex data processing programs. Looking ‘under the hood’ does not require looking into the module source; one can use modules to convert intermediate data in an easy to understand representation, e.g. into spreadsheets as shown here.
Andreas Bühlmeier, PhD.
January 2018
All rights reserved.
Disclaimer applies – see Impressum / legal notice